Charting with quantmod falls into two categories:
- Price charts
- Technical Analysis
At present only number 1 is implemented, though a complete charting facility is planned for the next few releases. A sneak peek is available in the examples section of the site.
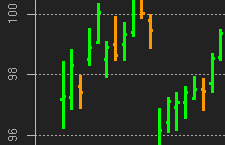
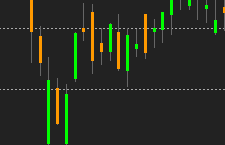
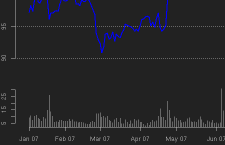
The basic charts (bars, candles, and lines) are available, with options fine-tuning the overall look (e.g. select background colour or include volume). Click the images to view the the full chart.
To start - a simple bar chart with volume

A little fancier looking - candles for those who prefer

And for non-OHLC style data, or a just a simple line

All of the above are easy to replicate for your own enjoyment. charts.R
> # load quantmod, then some data, and charts away...
> library(quantmod)
> getSymbols("IBM")
>
> barChart(IBM)
> candleChart(IBM)
> lineChart(IBM)